

Liberals Top the Poll. The Right Tops the Killings
Reading Two Charts of American Political Violence

I have two charts open on my laptop. They sit side by side, the way two contradictory hospital lab reports sat on a clipboard during my son’s week in the ICU.
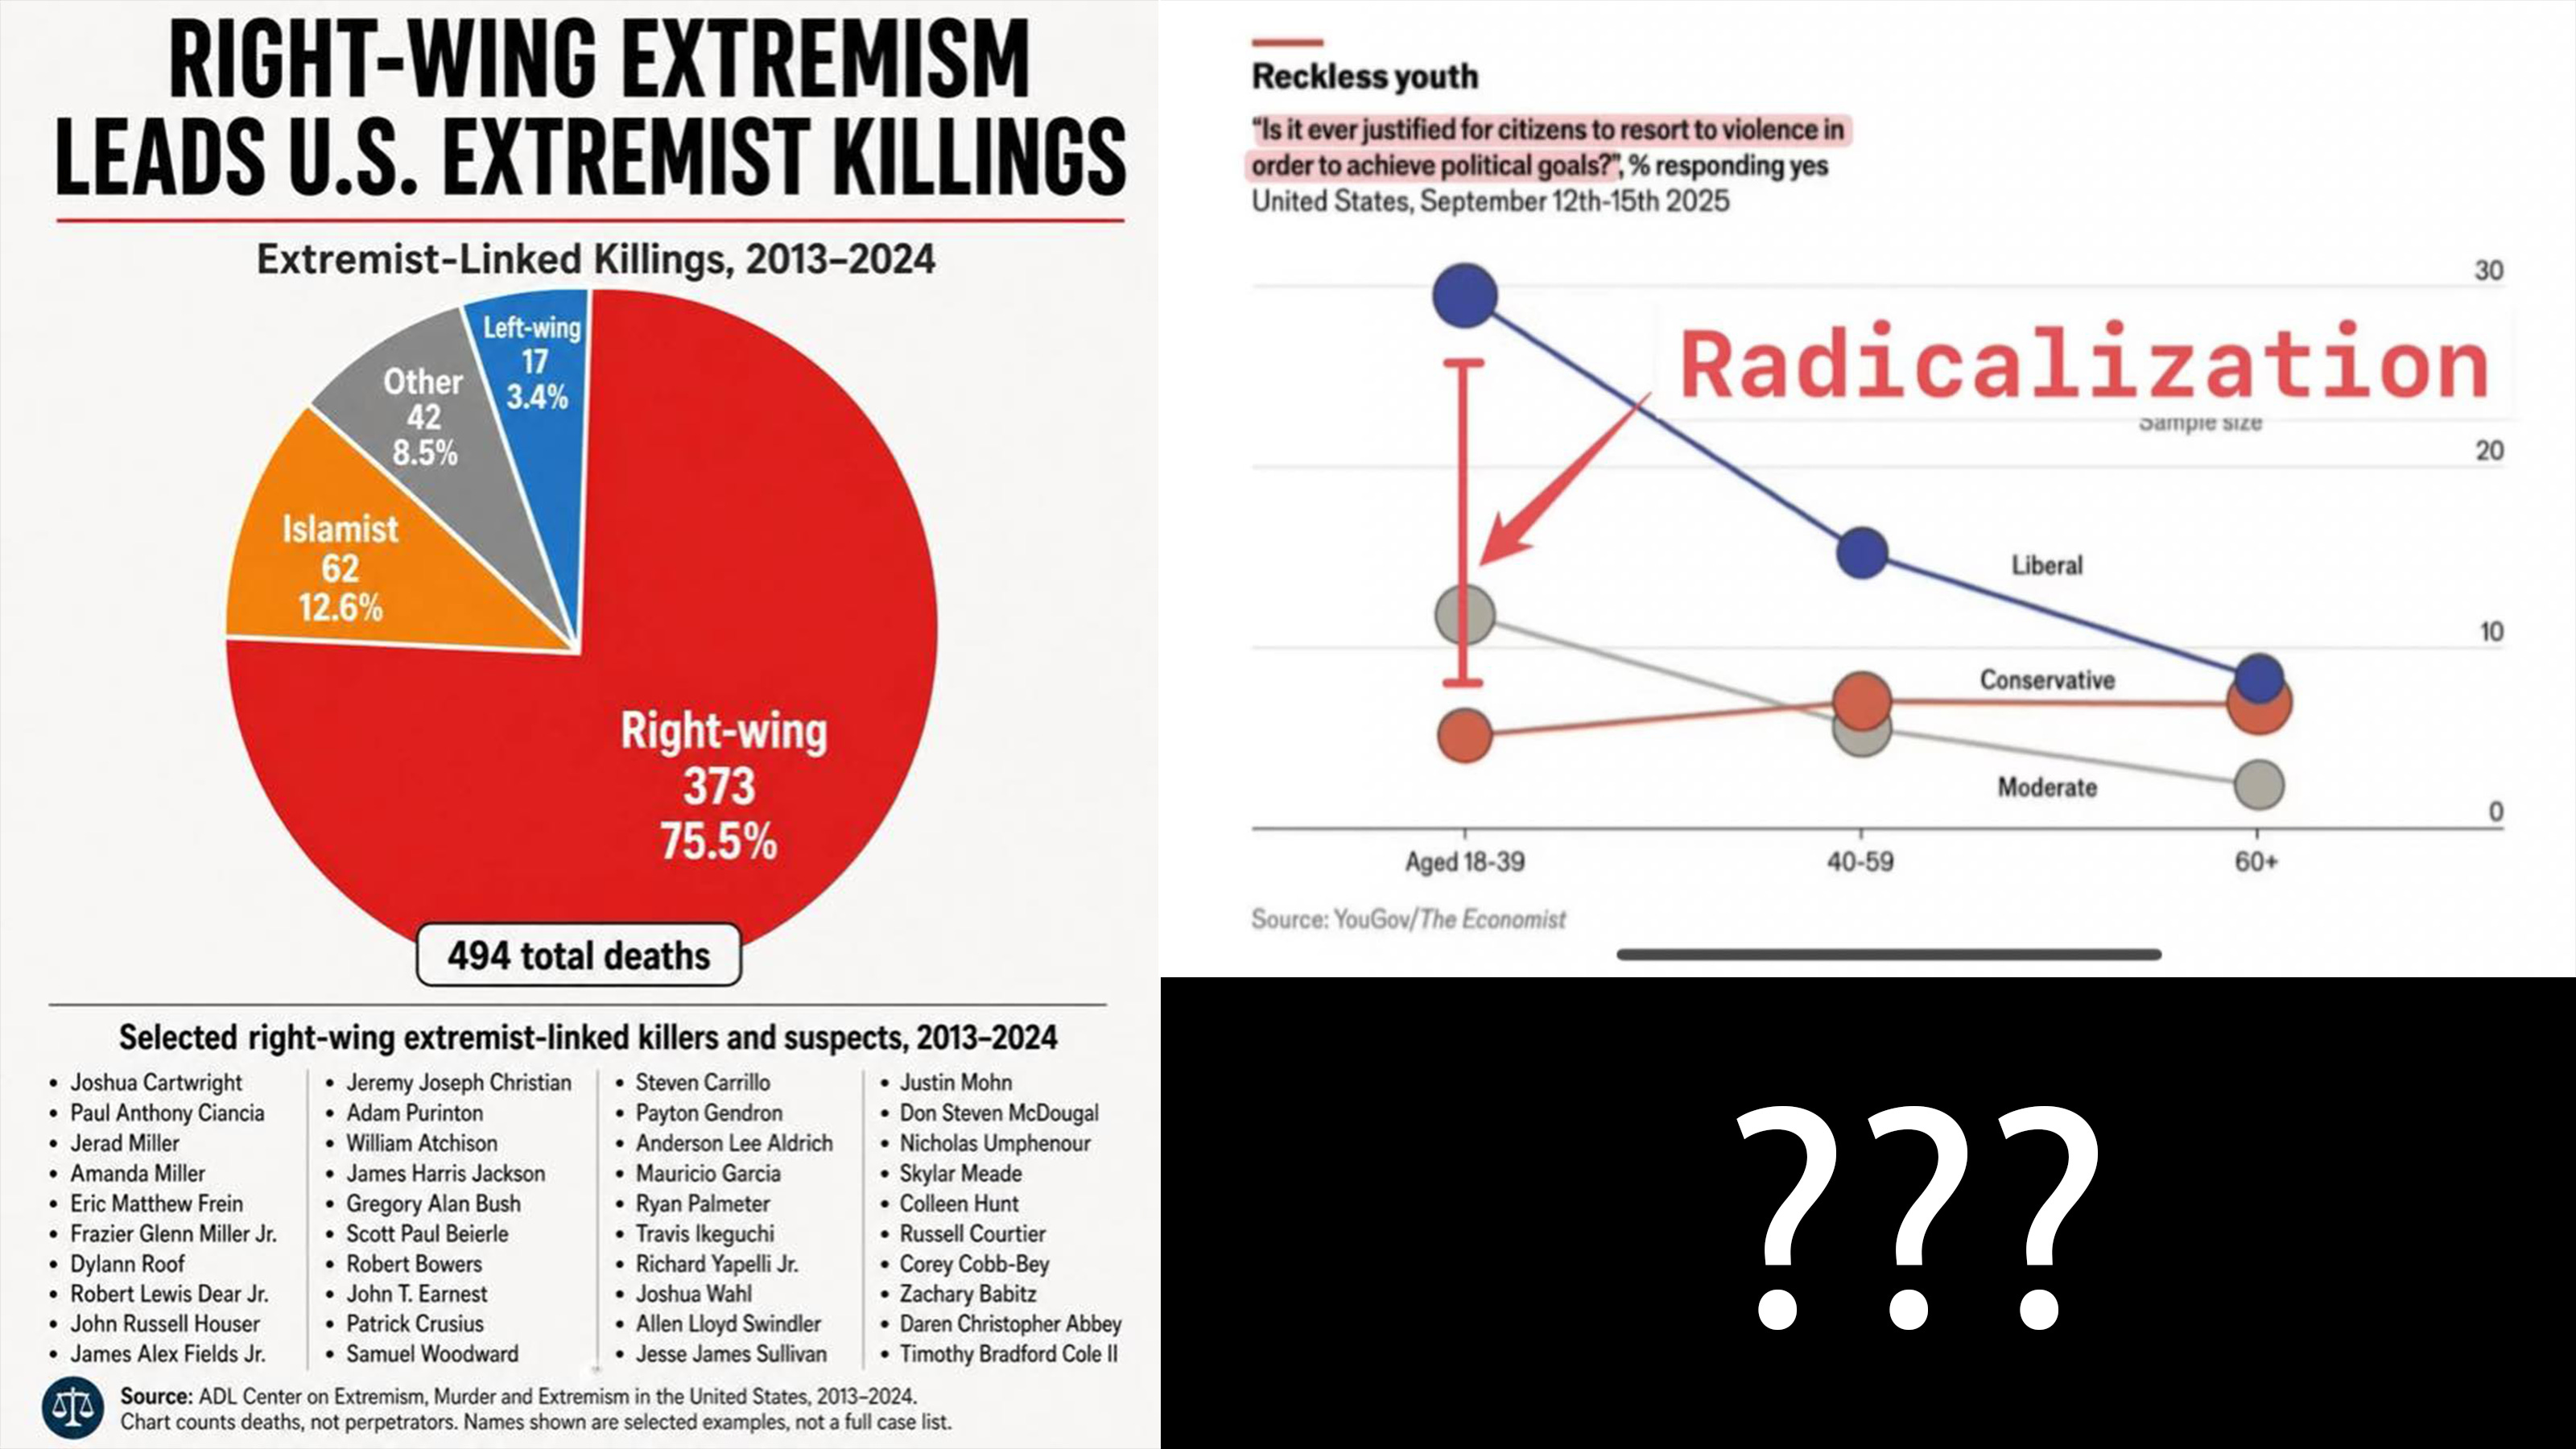
The first is a magazine chart. The Economist published it the morning of September 16, 2025, six days after a 31-year-old conservative named Charlie Kirk was shot in the neck during a debate with students at Utah Valley University. The headline above the chart reads, in tidy serif, “Reckless youth.” A blue line marked Liberal jumps off the y-axis at age 18 to 39, hitting roughly 30 percent. The dotted gray and red lines below it, Moderate and Conservative, sit between 4 and 12 percent. The chart asks 1,567 American adults 1 question: Is it ever justified for citizens to resort to violence to achieve political goals? (Economist & YouGov, 2025).
The second chart is a pie. It comes from the Anti-Defamation League’s annual report on extremist murders. The largest wedge is painted the color of a stop sign. Across it, in white letters, sit the words Right-wing 373, 75.5%. Below the pie, a list of names runs in two narrow columns. Some I knew on first read. Dylann Roof. Robert Bowers. Frazier Glenn Miller Jr., Patrick Crusius. Roof’s wedge was the Charleston AME church. Bowers’s was the Tree of Life synagogue in Pittsburgh. The list runs forty-six names long (Anti-Defamation League, 2025).
These are not the same kind of object. The first is a survey panel response. The second is a body count from twelve years of indictments. The methodological distance between a YouGov dropdown menu and a list of people who shot, stabbed, or drove a vehicle into a crowd is the entire point of this piece.
The right has waved a chart to claim the actual face of American extremism is a queer kid in a black turtleneck. The left has waved chart two to claim that all this hand-wringing about young liberals is statistical theater meant to draw attention away from the men who do the killing. Both moves are sloppy. Both leave evidence on the table.
Let me put both charts down and look at them honestly.
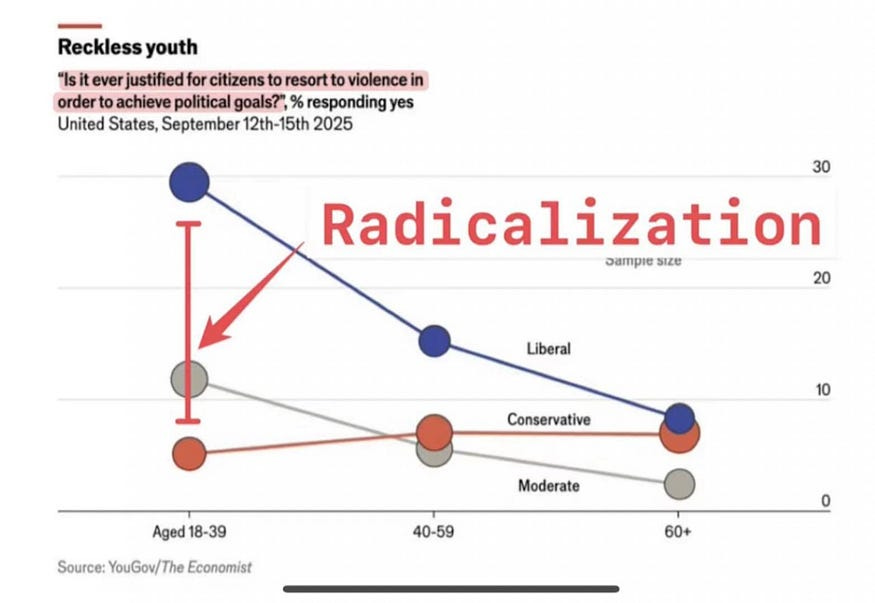
Source: YouGov/The Economist
What the YouGov chart actually measures
The Economist/YouGov tracking poll, fielded September 12 through 15, 2025, asked a single question. The toplines were calm. Seventy-eight percent of Americans said violence is never justified to achieve political goals, including 75 percent of Democrats and 89 percent of Republicans (YouGov, 2025a; YouGov, 2025b).
The trouble starts in the cross-tabs. Adults under 30 said “never justified” at 63 percent, against 82 percent for older Americans. Among self-identified “very liberal” respondents, 25 percent said violence could “sometimes be justified.” A separate Harvard Youth Poll fielded after the Kirk killing put the figure higher, with 40 percent of young Americans saying political violence was acceptable under at least one specified circumstance (Harvard Public Opinion Project, 2025).
Take a beat with that 40 percent. It looks lethal. It is not, in any operational sense, what it appears to be.
The most thorough academic treatment of why these numbers misbehave comes from Sean Westwood and his coauthors at Dartmouth, Stanford, and UC Santa Barbara, writing in the Proceedings of the National Academy of Sciences (Westwood et al., 2022). Their paper, blunt enough to start a small academic war, was titled “Current research overstates American support for political violence.” Across four large survey experiments with 4,904 respondents, they found that prior estimates inflated apparent support for violence by about a factor of 6.
Two reasons. Hypothetical questions about “violence” without specifying what kind let respondents answer about whatever shape of confrontation lives in their heads. A respondent picturing a shoving match at a school board meeting and a respondent picturing an assassination both pick the same yes button. And a portion of any large online sample is composed of people clicking through to collect the incentive payment, with attention so degraded that random response patterns swamp the signal at the low-prevalence end. After Westwood and colleagues controlled for both, the median estimated support for partisan violence dropped from about 18.5 percent to about 2.9 percent. Specific extreme acts, when named, draw single-digit support across the spectrum.
Nathan Kalmoe and Lilliana Mason, writing in Radical American Partisanship, pushed back hard (Kalmoe & Mason, 2022). They argue that the trend lines and demographic patterns hold even when measurement error is taken into account. The argument between the two camps is now a fixture of political-science conferences. Both sides agree on a few quiet points. Most respondents who say yes to a vague violence question do not, when pressed about killing or shooting, say yes again. The pool that endorses lethal violence in any concrete form sits in the low single digits. And that small pool’s composition shifts with which side has just been attacked.
What does this mean for the spike on The Economist chart?
It means the spike is real, in the sense that more young liberals than older or right-leaning Americans selected the ‘yes’ option’. The gap between selecting that button and walking out of one’s apartment with a rifle is the entire span of a person’s life. The chart is not measuring a force. It is measuring the temperature.
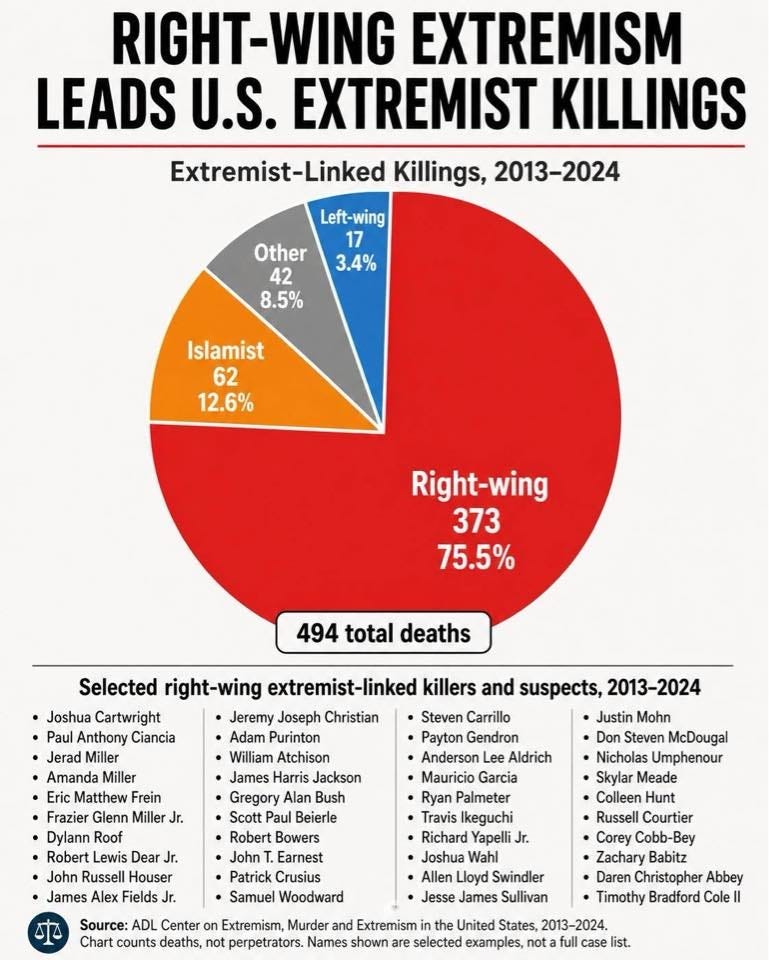
Source: ADL Center on Extremism, Murder and Extremism in the United States, 2013–2024
What the ADL chart actually measures
The ADL Center on Extremism has tracked extremist-related murders for ten years and traces underlying incidents back to 1970. The methodology is constrained in a way that the polling work is not. ADL counts a death only when an offender has documented ties to an extreme ideology or movement. The connections sometimes take years to surface, which is why each year’s report revises the prior year’s totals upward. Their 2023 figure rose from 17 in the initial report to 20 in the latest one. The 2022 figure rose from 25 to 28 (Anti-Defamation League, 2025).
Eight of the thirteen 2024 deaths involved white supremacists; five were tied to sovereign-citizen and other anti-government far-right offenders. For the third year running, every documented extremist-related killing in the U.S. was committed by someone connected to the right.
This is not an artifact of one organization’s bookkeeping. The Center for Strategic and International Studies documented the same distributional shape years earlier (Jones, 2018). The PIRUS database at the University of Maryland, which catalogs more than 3,500 radicalized individuals over multiple decades, shows the same asymmetry. Far-right offenders make up the largest single ideological category in PIRUS at 1,678 individuals, against 537 far-left and 579 Islamist offenders (Jensen et al., 2023).
The ADL pie is a typical view of a stable empirical pattern. Right-wing radicalization, in the United States, kills more people than any other category. The gap is wide enough that disputing it requires an enormous amount of ideological labor.
Why the two maps disagree
Consider what has to be present for an attitude to mature into a corpse.
First, an ideology that names a target. Researchers writing on radicalization-to-violence pipelines have shown that vague generalized anger does not produce lethal acts. Specific accelerationist propaganda does. Robert Bowers, who killed eleven worshippers at Tree of Life in October 2018, had spent months on Gab posting that the Hebrew Immigrant Aid Society “likes to bring invaders in that kill our people,” and walked into the building shouting “All Jews must die” (Counter Extremism Project, 2023). Payton Gendron drove more than 200 miles from Conklin, New York, to a Tops grocery store in Buffalo, picked his target by Black population density, and posted a 180-page document citing the Christchurch shooter and the “Great Replacement” theory (Anti-Defamation League, 2022). All three documents pull from a common library. There is, on the left, no equivalent canon. There are angry posts. There are calls to disrupt this or that hearing. There is no organized library that names a category of human beings and instructs the reader to remove them from the country.
Second, access to the right tools. The ADL data show firearms were used in 75 percent of extremist-related killings over the past decade. The Wintemute group at UC Davis has documented across multiple survey waves that respondents endorsing political violence are more likely to be regular firearms owners and to have brought firearms to a public protest (Wintemute et al., 2024). In Wintemute’s 2022 survey, the people most willing to say they would shoot another person to advance a political objective were not first-year college students. They were middle-aged men with full gun safes.
Third, the act has to crawl out of the head and into the world, which most of the time it does not. There is a clinical phrase for this: the action threshold. Acts of political killing in the United States, even in a year as bloody as 2024, run in the dozens. The U.S. saw about 150 politically motivated attacks in the first six months of 2025 (Reuters, 2025). That count is still drowned in the noise of ordinary criminal homicide, which killed approximately 19,400 Americans in 2023, the most recent year for which the Bureau of Justice Statistics has finalized estimates (Bureau of Justice Statistics, 2025).
The ratio of attitude to act is something like a million to one, and the funnel narrows at every stage.
The 2025 cases that test the pattern
On June 14, 2025, Minnesota State Representative Melissa Hortman, the former Speaker of the State House, was shot dead in her home along with her husband Mark by a 57-year-old man named Vance Luther Boelter. State Senator John Hoffman and his wife, Yvette, were shot an hour earlier in their own home and survived. Boelter was a registered Republican and an evangelical Christian. He drove a black Ford Explorer disguised as a police vehicle, wore body armor and a silicone mask, and carried a notebook with about seventy targets, almost all of them Democrats (U.S. Department of Justice, 2025; National Public Radio, 2025). Boelter had delivered sermons at a Pentecostal church in Matadi, Democratic Republic of the Congo, where he preached that the devil had “gotten so far into” the minds of people who “don’t know what sex they are” (Conversation, 2025).
I want to name something here. I am a baptized, confirmed, currently-pew-warming member of the Evangelical Lutheran Church in America. I run the audio-visual booth at a country congregation outside Sioux Falls. The Christianity Boelter preached in that Congolese sanctuary is not the Christianity I hear out of any ELCA pulpit I have ever stood beside. It is, instead, recognizable to anyone who has read the post-Constantinian history of the church, where a teaching about loving your enemy got fitted, century by century, with a sword. The man from Galilee did not own a list of seventy people to kill. The one who took the gospel and turned it into an imperial weapon arrived three hundred years later (Ehrman, 2005; World Council of Churches, 2025). Boelter is a small inheritor of that long arrangement. The Lutherans who raised me would call what he did blasphemy in the precise sense of the word.
The Hortman shooting did not break the pattern. It thickened the right-wing slice.
The killing that tested the pattern, at least at first reading, was the Charlie Kirk assassination on September 10, 2025. Kirk was a 31-year-old conservative campus speaker. The accused shooter, 22-year-old Tyler Robinson, lived with a transgender partner and, according to family members, had drifted left in the year before the killing (Cable News Network, 2025).
Robinson is precisely the kind of person whose existence makes a queer trans researcher in Sioux Falls put her coffee down and read a transcript twice. Most political-violence pundits I read have one of two reactions to him. The first is to deny the trend the YouGov chart is picking up, calling Robinson an outlier whose case has been exaggerated to scapegoat the left. The second is to take Robinson as the harbinger of a wave of left-coded political violence about to flood American campuses. Neither reaction is honest.
Robinson is one case. His preliminary hearing is set for May 18, 2026, and he has not yet entered a plea (CNN, 2025). His motivations are still being reconstructed. Treating his case responsibly means saying out loud that one killing does not move a twelve-year average, and saying out loud that if the next ADL pie chart shows a sliver of color where there has not been one for several years, Robinson will likely be the reason.
I think this is what the YouGov chart is warning about. Not a wave of leftist mass killers. A small but rising willingness on the youngest progressive flank to picture violence as a tool. Whether more follow depends on whether anyone builds the kind of infrastructure that turns a 30 percent on a poll into a body count.
Why does the right see a different pie?
If you live on a Fox News, Newsmax, talk radio, and X media diet, you do not see the pie chart in image two. You see, on a roughly nightly cycle, a different list. Arson at a Tesla showroom in Las Vegas. The doxxing of federal judges. Jane’s Revenge graffiti and arson at crisis pregnancy centers. The Luigi Mangione shooting of UnitedHealthcare CEO Brian Thompson on a Manhattan sidewalk in December 2024. Robinson at Utah Valley. The two attempts on Donald Trump’s life in the summer of 2024.
Each event on that list is real. Each, on the right-leaning view, slots into a pattern named “left-wing political violence.” On a right-leaning informational diet, the resulting picture looks asymmetric in the opposite direction the ADL data suggest.
Yochai Benkler, Robert Faris, and Hal Roberts of Harvard’s Berkman Klein Center spent the 2015–2018 cycle producing the most thorough study of why this argument keeps happening, published as Network Propaganda (Benkler et al., 2018). They tracked more than 1.25 million online stories. The American media ecosystem, they found, is not a single connected web with two ideological poles. It is two ecosystems. The center-left, center, and center-right share fact-checking norms, professional newsroom culture, and feedback loops that correct over time. The right, anchored by Fox News, Breitbart, and the talk-radio web, operates as a more enclosed circuit that rewards loyalty over accuracy. When a story flatters the tribe, it travels. When it does not, it does not.
In the Boelter case, several right-wing accounts on X placed him as a leftist or a Walz appointee within hours of the shooting, and some kept that frame up for days after his voter registration, evangelical sermons, hit list of Democrats, and anti-abortion notebook entries became public (MinnPost, 2025). When a far-right shooter is named, the ecosystem reaches first for “lone wolf,” “mentally ill,” “not really political,” “his own thing.” When a left-coded shooter is named, the same ecosystem reaches first for “this is what the left has been telling us all along” and stays there.
A 2013 study in Criminology and Public Policy found that 40 percent of “lone wolf” domestic terrorists in the United States had a documented history of mental illness, with no meaningful partisan difference (Poynter Institute, 2017). Mental illness is not a partisan trait. It is a human one. The framing is the partisan trait.
The result is two parallel pictures of the same country. On one, right-wing extremism kills three out of every four people killed by extremists. On the other hand, the left is the violent one. Both pictures sit inside heads that vote, post, donate, and own firearms. The picture you see is partly a function of the picture you are shown.
I do not say this to flatter the left. The center-left and the left have their own filters. Brian Thompson’s family deserves the kind of obituary writing the Tree of Life victims got. They did not get it. That is a real failing. The right’s filter is a more concentrated version of a problem the rest of our press shares.
How a queer trans woman reads these charts
I will admit a bias I cannot subtract. I live in South Dakota, a constitutional carry state since 2019, where my neighbors keep .30–06 rifles racked behind the back seats of their pickup trucks during deer season. The deer-camp coffee shop in November looks like a small armory at sunup. The list under the ADL pie includes several names whose victims looked or worshipped or loved like the people I love or like me. I am a member of one of the categories of human beings the accelerationist canon explicitly names.
That bias does not entitle me to dismiss the YouGov chart. If anything, it forces me to read it more carefully. A queer left that drifts toward endorsing violence as a legitimate political tool would not become safer. It would become slightly more like the people who have hunted us, with a worse track record and fewer guns. Every honest American movement that achieved durable progress, including the gay liberation movement that made my life possible, did so by combining moral seriousness with strategic non-lethality. The Mattachine Society did not run a body count. ACT UP staged die-ins on the FDA’s lawn in 1988, carrying placards painted with the names of the dead; nobody on the other side of the protest got hurt. The Stonewall riot involved bricks and high heels, no bullets.
To my younger comrades clicking yes on a YouGov panel: please do not romanticize the people in the second chart by trying, in some clumsy mirror image, to become them.
The trans Second Amendment story deserves its own paragraph. NPR’s reporting from more than thirty interviews with gun trainers, club organizers, and shop owners documents a sustained surge in firearms purchasing among LGBTQ Americans, especially trans Americans, since the November 2024 election (Naylor, 2025). The Liberal Gun Club, with chapters in more than thirty states, grew from 2,700 members in November 2024 to roughly 4,500 by November 2025. Pink Pistols, founded in 2000, has reported the addition of more than 20new local affiliates since the 2024 election (Tabachnick, 2025).
Pink Pistols’ motto for a quarter century has been “Armed gays don’t get bashed.” The FBI logged 492 anti-transgender hate crime incidents in 2023, the highest figure since the category was added to the data in 2013 (Arab American Institute, 2024). The Transgender Day of Remembrance, accounting for the year ending October 2025, documented 27 trans and gender-nonconforming people murdered in the United States, with 17 killed by gunfire (Advocate, 2025). On those numbers, the constitutional right of a member of that demographic to lawfully purchase, carry, and train with a firearm is no longer a controversial proposition. It is what the Bill of Rights actually says.
The conversation in the survey tab and the one at Pink Pistols are not the same. Lawful, trained self-defense is no endorsement of partisan violence. The first is a constitutional right. The second is a Westwood-paper artifact of vague survey wording. Conflating them is a category error your enemies will exploit.
To my older liberal friends: the person at the next concealed-carry class in a small Midwestern county might be a 60-year-old trans woman who runs the audio-visual booth at her ELCA congregation on Sunday mornings. The instinct to legislate her out of the firearms market in the name of public safety is, in the current political weather, the instinct that gets her hurt first. Sometimes, the people you most want to protect with a regulation are the people the regulation hurts soonest.
To right-wing readers who have read this far: the trans person at the rural rifle range is not the trans person on cable news. She is exercising the Bill of Rights you have spent fifty years defending. The constitutional posture you built, properly applied, includes her.
What an honest reader takes from both charts together
The Economist chart and the ADL chart are not in conflict. Each measures what it says it measures, with the caveats baked into its method. Together, they give a textured picture. Most Americans across the political spectrum reject political violence. A small minority, concentrated on the very liberal and very young end of the distribution, is willing to tell a survey otherwise. A still smaller subset will endorse a specific lethal act when pressed. A vanishingly small subset will ever do anything. The set of people who actually have done something is dominated, year after year, and to a degree that holds across multiple datasets, by right-wing offenders.
If a reader takes one number from this piece, take this one. Across the past twelve years cataloged by the ADL, right-wing actors accounted for roughly 76 percent of extremist-linked killings (Anti-Defamation League, 2025). Across well-designed survey experiments, support for specific lethal political violence among American adults sits around 3 percent (Westwood et al., 2022). The first number describes what happens. The second describes what people will say in a clean room. The first is the behavior. The second is the temperature. Neither cancels the other. Mistaking one for the other is the most common mistake in our current discourse.
The pie can shrink. The temperature can fall. Both have happened in U.S. history before, including in living memory. Neither shrinks when someone shouts at the other side at the people who already agreed with them. The work is more boring than that. Read the Westwood paper. Read the ADL methodology page. Sit across the table from a 22-year-old who clicked yes on a YouGov panel and ask what they pictured when they read the word “violence.” If the answer involves a school board meeting, you have a different conversation on your hands than the one we have been having on television.
For a little more depth, check out my research paper on this topic:

Author Note: Grace Ann Hansen is an independent researcher and writer, and an MBA & PhD graduate student in health informatics and artificial intelligence. She is also a published author, a professional musician, a gymnastics coach, and a queer transgender woman living in Sioux Falls, South Dakota. She corrects all her papers and articles with Grammarly, because even though she has deep thoughts, she has shallow patience for punctuation. Correspondence concerning this article should be addressed to Grace Ann Hansen at grace@graceannhansen.com.