

Every Number in This Post Is Real. The Story Is Still False.
A viral post blamed New York’s rent on a mayor who had been in office five weeks.

A viral post blamed New York’s rent on a mayor who had been in office five weeks. Here is how true figures get assembled into a lie.
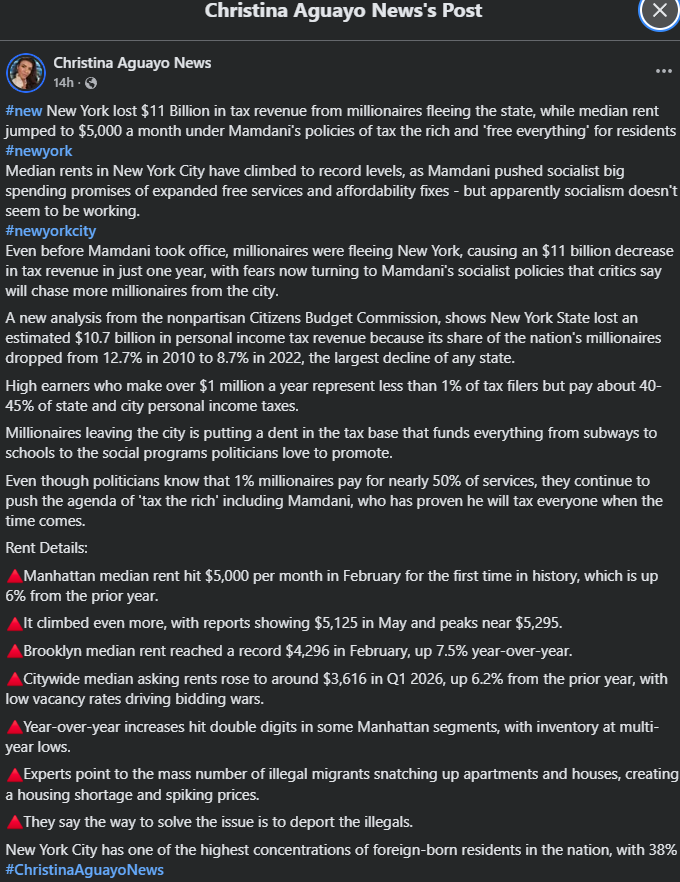
Start with the sentence that does all the work. A post now circulating on Facebook says New York “lost $11 Billion in tax revenue from millionaires fleeing the state.” New York didn’t lose eleven billion dollars. It didn’t lose one dollar. There was no drawer with the money in it, no moment when the money was there and then wasn’t. The figure comes from a hypothetical the post quietly relabels as a fact, and once you see the relabeling you can watch it happen four more times in the same post.
I want to be precise about what’s wrong here, because most of the post isn’t wrong. The rent numbers are real. The tax figures are real. The percentages are quoted accurately from a real report by a real nonpartisan watchdog. If you fact-check this post the lazy way, checking whether each number exists, it passes. That is exactly why it works. The lie isn’t in the arithmetic. It lives in the joints between the numbers, in the causal connectors, and the connectors are the one part nobody checks.
The eleven billion that was never in the drawer
The source is a Citizens Budget Commission report titled The Hidden Cost of New York’s Shrinking Millionaire Share, written by the CBC’s vice president for research, Ana Champeny, and dated August 28, 2025. The post calls it “a new analysis.” It’s eleven months old and was recirculated this month alongside a separate CBC dashboard release.
Here is what the report actually says. Had New York held its 2010 share of the nation’s millionaires, the state “would have received $10.7 billion more in PIT revenue” in 2022. Would have received. That is a counterfactual: a comparison between what happened and an imagined world in which the trend line held flat. It’s a perfectly ordinary way for budget analysts to talk. It’s not a loss. Money you never collected under a scenario that never occurred didn’t go missing. The post converts “would have received more” into “lost,” and that single verb swap is the engine of the whole thing.
Now the part the post leaves out. By the CBC’s own count, the number of millionaires in New York State went from 35,802 in 2010 to 69,780 in 2022. It nearly doubled. The “declining share” is real, but it describes New York growing its millionaire ranks slower than California, Texas, and Florida grew theirs, not millionaires walking out the door. Nationally, the number of millionaires nearly tripled. Florida’s quadrupled. New York gaining millionaires while its slice of a fast-growing national pie shrinks is a very different story from New York bleeding them, and it’s the true one.
And revenue didn’t fall. New York’s Department of Taxation and Finance reports collecting over $61 billion in personal income tax in fiscal year 2024 to 2025, the state’s single largest revenue source, with the number of filers back near the 2020 peak of eleven million. The State Comptroller’s own records show 2022 personal income tax receipts rising 28.7 percent over the prior year. The post’s headline claim is that millionaires fled and revenue cratered. Millionaires nearly doubled, and revenue hit record levels. Both halves of the claim are backward.
The CBC report is careful in ways the post isn’t. It states plainly that “the evidence about the impact of taxes isn’t clear-cut.” It notes that “high-tax California’s growing millionaire share shows taxes aren’t New York’s only challenge.” It calls its own case for tax-driven flight “ample anecdotal evidence.” It flags that part of that $10.7 billion counterfactual comes from a 2021 rate increase, not migration, and that the wild year-to-year swings “stem from the volatility of capital gains,” which track the stock market, not moving vans. Read the report, and you find a hedged, technical document about New York’s competitive position. Read the post, and you find an exodus. The report didn’t say that. The post needed it to.
One credit where it’s due: the post’s line that millionaires account for under 1 percent of filers but pay roughly 40 to 45 percent of state and city income taxes is accurate. The CBC puts it at 44 percent of state personal income tax and 40 percent of city personal income tax in 2022. High earners genuinely are a load-bearing part of New York’s budget. That is precisely why the accuracy of the flight claim matters, and why inventing a flight that isn’t happening does the city no favors.
The mayor who had not done the thing yet
Now watch the second move, which is chronological. The post ties the record rents to “Mamdani’s policies of tax the rich and ‘free everything.’” Zohran Mamdani took office on January 1, 2026. The $5,000 Manhattan median the post leads with was set in February, his second month. So walk through what actually existed on that date.
The millionaire tax didn’t exist. It still doesn’t. Mamdani campaigned on raising the city’s top income tax rate, but that would require Albany, and Governor Kathy Hochul blocked it throughout the entire 2026 budget and legislative session. As City & State New York reported on June 5, 2026, what passed was a pied-a-terre tax on non-primary homes worth more than $5 million, not the broad income tax hike he ran on. You can’t blame a February rent number on a tax that was proposed, contested, and largely rejected.
The rent freeze didn’t exist either. The Rent Guidelines Board approved Mamdani’s freeze on June 25, 2026, and it takes effect October 1, 2026. February rents were set four months before the vote and eight months before the policy starts. The freeze also applies to rent-stabilized apartments, not the market-rate new leases that produce that $5,000 median in the first place. It’s difficult to construct a cleaner example of an effect preceding its alleged cause.
The “free everything” is a free childcare program for two-year-olds, starting this fall with 2,000 seats, plus some fare-free bus pilots. Whatever you think of that agenda, none of it had spent a dollar or frozen a rent by February. The post blames a mayor for the consequences of policies that were blocked, not voted on, or not yet begun.
What actually moved the rent
Read that paragraph again if it went by fast, because here is the turn. The rent numbers in the post are real and alarming. Manhattan’s median hit $5,000 in February 2026 for the first time on record, up 6 percent year over year, per the Corcoran Group. It climbed to $5,125 in May and $5,295 in June. Brooklyn set records too. These aren’t in dispute. What’s in dispute is why, and the industry measuring the rents has been telling anyone who asks.
The answer is supply. Plenty of forces tug at any single rent, but the trend has one driver: the number of new apartments, and Manhattan has been adding almost none. StreetEasy reported that February 2026 marked the twenty-fourth consecutive month of year-over-year rental inventory decline in Manhattan, “the longest streak ever recorded” in its twenty-year history. Count backward. A twenty-four-month streak, ending in February 2026, began in early 2024 under Mayor Eric Adams, two years before Mamdani took office. Manhattan received only about 14 percent of the roughly 18,600 new rental units built citywide in 2025. Gary Malin, the chief operating officer of the Corcoran Group, whose own report the post is quoting, points “more directly to a shortage of housing stock as the factor driving the surge in prices.” The records were already falling before this mayor existed in office: Manhattan’s median hit a then-record $4,571 in May 2025, under Adams.
A careful reader will raise one more supply-side wrinkle, and it deserves a straight answer. In June 2025, the city’s FARE Act took effect, shifting broker fees from tenants to whoever hires the broker. A landlord who used to hand a renter a one-time fee can now fold that cost into the monthly rent, and the industry has spent a year arguing over how much that pushed advertised rents up. StreetEasy, which backed the law, found that formerly fee-free apartments rose only about a point faster than units that were already fee-free, a small bump; brokers on the other side clocked a sharp jump in the first weeks after it landed. Grant the whole dispute, and it still can’t be the story. The inventory slide had been running since early 2024, more than a year before the FARE Act existed, and Manhattan’s median had already set a then-record that May, weeks before the law took effect. It may have moved a number here and there. It didn’t start the trend.
A rent record set in February 2026 is the product of a supply collapse that began in 2024 and a construction shortfall that predates the administration. The mayor is thirty days into the job. The trend is two years old.
The migrants who were in shelters, and the ones who left
The post’s next claim is that “experts point to the mass number of illegal migrants snatching up apartments and houses,” and that the fix is to “deport the illegals.” No expert is named, which under any honest sourcing standard is where the claim should stop. But it’s worth refuting on the merits, because the data runs the other direction on three separate counts.
First, New York City’s undocumented population fell. The Center for Migration Studies, analyzing Census data, found that the city’s undocumented immigrant population dropped by 19 percent between 2010 and 2023, the same period during which rents climbed. The total number of foreign-born grew by about 2 percent, driven by a 17 percent rise in naturalized citizens, not unauthorized arrivals. Fewer undocumented residents, higher rents. That is the opposite of the causal story.
Second, the asylum seekers who did arrive were in shelters, not competing for market-rate leases. As of May 31, 2024, the New York City Comptroller counted 49,460 asylum seekers in city-paid hotel rooms. They were housed in an emergency shelter system, not bidding on the apartments that set the $5,000 median.
Third, the shortage predates them and dwarfs them. The 2023 New York City Housing and Vacancy Survey, the official Census-partnered count, found a net rental vacancy rate of 1.41 percent, the lowest since 1968. Adams’s own housing commissioner said, “the demand to live in our city is far outpacing our ability to build housing.” And the scarcity was worst at the bottom of the market, with a 0.39 percent vacancy rate for units under $1,100, and loosest at the top, with a 3.39 percent vacancy rate for units over $2,400. If migrants were the cause, the crunch would land hardest where they live. It lands hardest on the cheapest apartments and eases at the luxury end, which inverts the post’s story a third time.
I will give the strongest version of the counterargument its due, because it exists. The economist Albert Saiz, in a 2007 study in the Journal of Urban Economics, found that an immigration inflow equal to 1 percent of a city’s population is associated with roughly a 1 percent rise in average rents. Immigration does add housing demand, and that pressure is real. Run New York’s own migration numbers through that coefficient, though, and the mechanism thins out. Net international migration into the city from 2022 through 2024 ran historically high, on the order of 4 percent of the city’s population, and the Census Bureau has since revised even that figure upward. Under Saiz’s one-to-one rule, that inflow buys at most a point or so of rent growth a year, set against the 6 percent Manhattan posted in the single year ending February 2026. And the wave has since receded to its pre-pandemic level while rents kept climbing, which is the reverse of what a migration story would predict. A one-to-one elasticity can’t carry a twenty-four-month inventory collapse, and it describes aggregate demand for housing, not foreigners “snatching up” apartments while natives watch. The mechanism the post needs isn’t the mechanism the research describes.
The exodus that keeps not happening
The last thread is the fear the post is really selling: that Mamdani will finish the job the “fleeing millionaires” started. Set aside that the flight has not happened. Ask whether the research says it’s coming.
It doesn’t. Cristobal Young of Cornell and Ithai Lurie of the Treasury Department published the definitive recent study in the American Journal of Sociology in 2025, tracking every million-dollar income earner in the country through IRS data. Their finding, consistent with a decade of this work, is that the 2017 federal tax overhaul, which sharply raised the cost of living in high-tax states like New York, “didn’t lead to a significant increase in tax migration.” Millionaires, it turns out, are embedded. Their wealth is tied to the place where they built it. When they do move, it’s rarely for taxes: the top destination for New York’s richest one percent is Connecticut, followed by New Jersey and California, all three of which levy a millionaire tax of their own.
And the market has already voted on the “Mamdani effect.” In November 2025, the month he won, contracts signed on Manhattan homes priced at $4 million or more rose 25 percent over the prior month, per appraiser Miller Samuel and Douglas Elliman. Donna Olshan, who tracks the luxury market, put it flatly: “There is no Mamdani effect.” Six months into his term, the exodus that was promised on the campaign trail had not materialized.
Here again I will not overstate the case, because honesty is the entire point of this exercise. Young and Lurie find that sensitivity is small but nonzero, and that taxes can shift where movers go even when they do not change how many move. Some wealthy New Yorkers will leave and will name the mayor. Ken Griffin has said his firm, Citadel, will expand in Miami, and he named Mamdani when he said it. The CBC’s underlying position, that taxes are one real factor among several, is defensible and I have quoted it as such. What isn’t defensible is the leap from “taxes are one factor in a slow competitive decline” to “millionaires are fleeing, and it cost eleven billion dollars.” The evidence supports the first sentence. The post is built on the second.
The anatomy, which is the part worth keeping
Strip the New York specifics away, and here is what’s left: this structure will show up again next week, attached to a different city and a different number.
Take a real report. Quote its most quotable figure accurately. Drop its caveats, which are where the honesty lives. Swap one verb so that “would have collected” becomes “lost.” Attach the resulting number to a politician the audience already dislikes, ignoring the calendar that says he wasn’t in office yet, that the policy was blocked, or that the trend predates his tenure. Name no experts for the ugliest claim so that no one can check it. And count on the reader to verify the true numbers, and never the connectors, which are false.
Every figure in that post can survive a fact-check, and the post can still be a lie because a fact-check that only asks “Is this number real?” checks the wrong thing. The number is real. The drawer was always empty. What you are being sold is the sentence that says otherwise, and it costs you nothing to read the caveats the way the analysts wrote them.
The CBC report is public. The rent data is public. The vacancy survey is public. The tax receipts are public. Read them in the order the analysts wrote them, caveats and all, and the exodus disappears. It was never in the drawer.
Grace Ann Hansen is an independent researcher and writer, and an MBA & PhD graduate student in health informatics and artificial intelligence. She is also a published author, a professional musician, a gymnastics coach, and a queer transgender woman living in Sioux Falls, South Dakota. All interpretation, argument, and prose are her own. Correspondence concerning this article should be addressed to Grace Ann Hansen at grace@graceannhansen.com.